Blog
Why We Must Employ DCMA-14 for Project Schedule Health Checks?
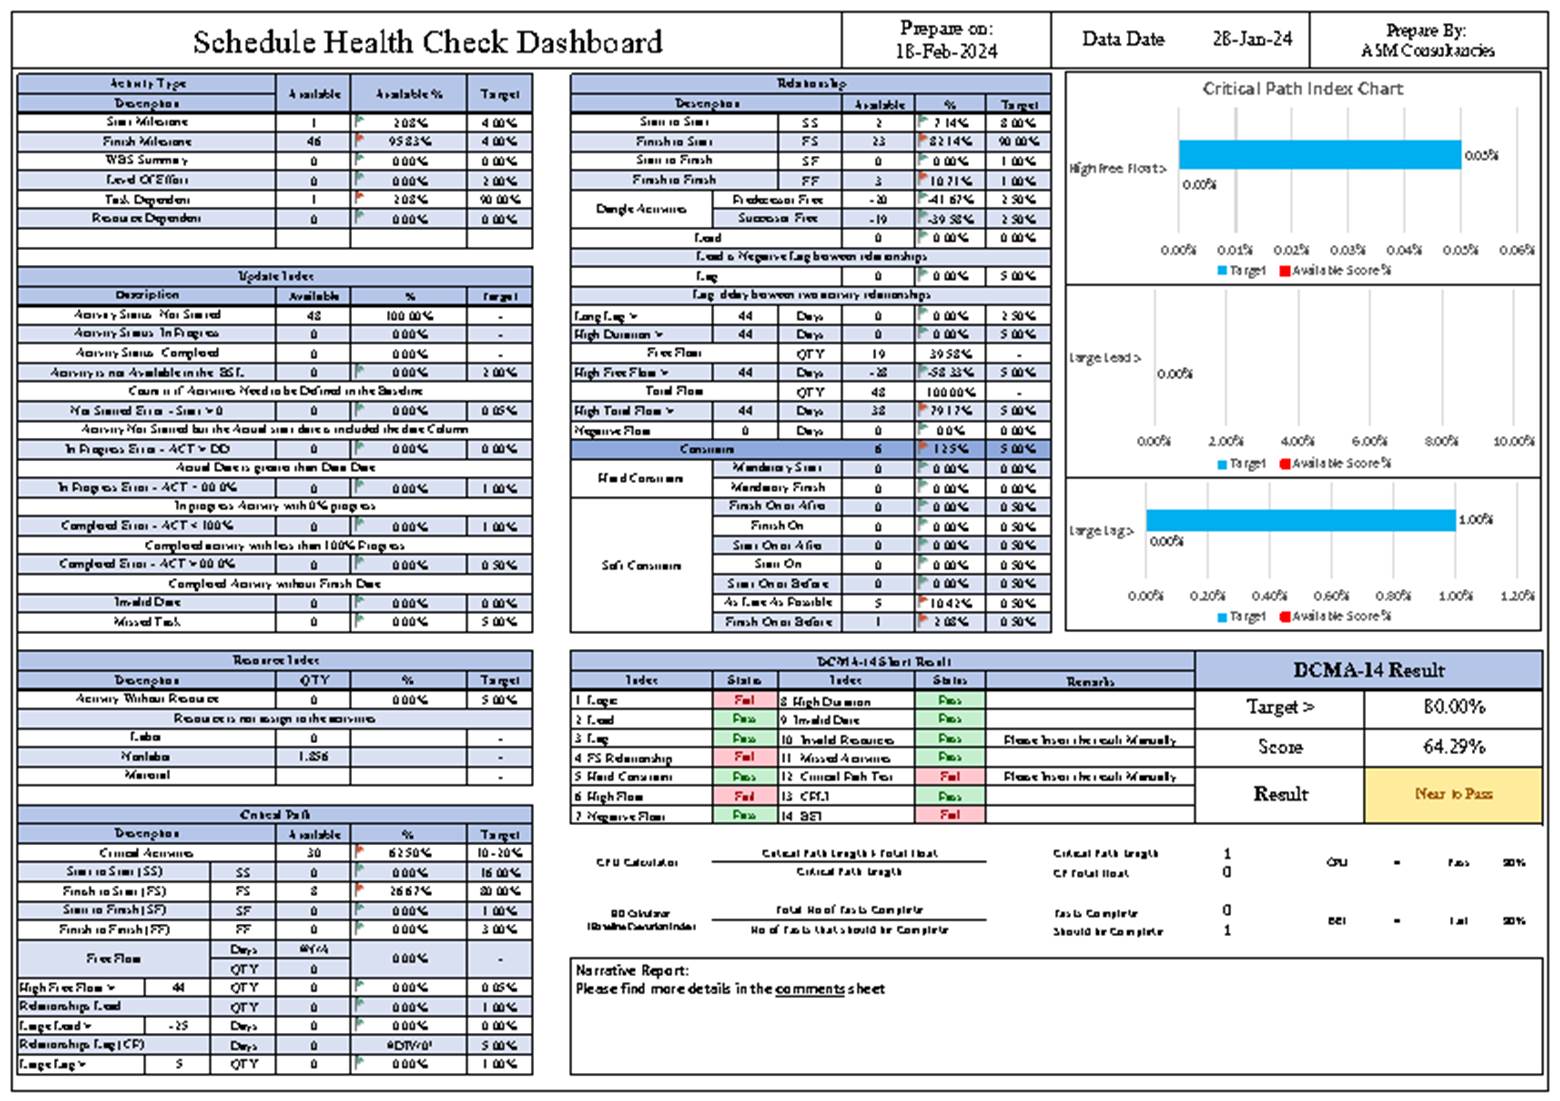
A Dashboard picture
Why We Must Employ DCMA-14 for Project Schedule Health Checks?
Although many do not consider it a formal industry standard, the DCMA 14 provides a comprehensive set of guidelines that help teams plan, manage, and successfully control project schedules.
What Are the Key Benefits of the DCMA 14-Point Assessment?
The DCMA 14 check-points guarantee numerous benefits for your project schedule. By implementing these metrics, we provide the following advantages for your project:
- We make possible a constant, in-depth analysis of the schedule.
- We quickly identify weak points in the schedule.
- We designate potential problems around project activities and create appropriate corrective plans.
- We ensure that you manage and execute the project successfully and on time.
Which Are the 14 Metrics of the DCMA 14-Point Assessment?
The US Department of Defense formed the DCMA 14-point Schedule Assessment criteria in 2005 and used them initially. Since then, they became a key guideline for schedule review that many project management software providers implement and use widely in the aerospace and defense industry.
These 14 metrics function not as necessary rules or standards, but more as measurable criteria. We strongly advise you to analyze them regularly during the planning, monitoring, and controlling stages of the project schedule. The ultimate purpose of these metrics is to indicate potential problems in the project schedule and, in the end, to ensure you manage your projects toward success.
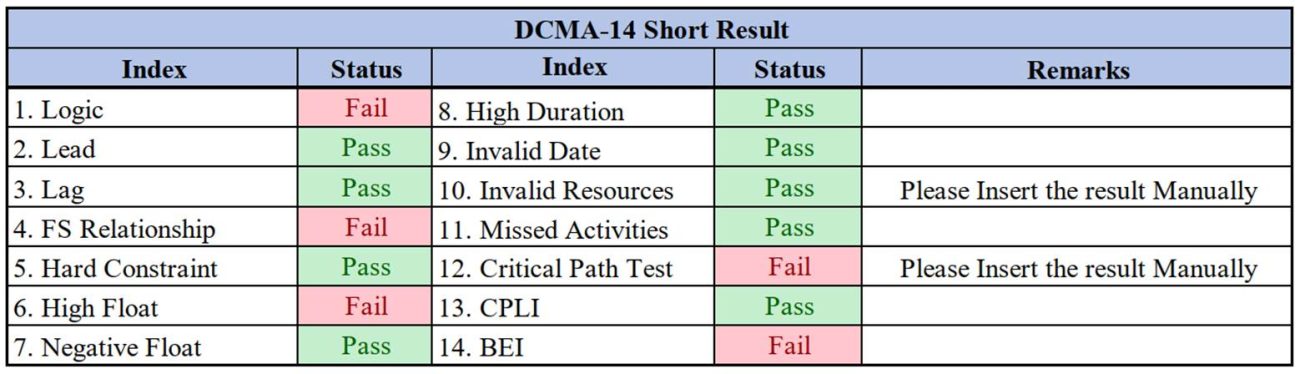
The metrics that need to be followed and examined are the following:
| Logic | High Duration |
| Leads | Invalid Dates |
| Lags | Resources |
| Relationship Types | Missed Tasks |
| Hard Constraints | Critical Path Test |
| High Float | Critical Path Length Index (CPLI) |
| Negative Float | Baseline Execution Index (BEI) |
Logic
The metric ‘Logic’ provides the possibility for measurement of the ‘%’ of incomplete tasks with no predecessors and/or successors, also called ‘dangling’ activities. For this metric, it is preferable that the number of unfinished activities missing predecessors and/or successors doesn’t exceed 5%.
The best practice for avoiding incompleteness of tasks is ensuring that every task has at least one finish-to-start or start-to-start relation as its predecessor and at least one finish-to-start or finish-to-finish as its successor. This metric is important in investigating how project tasks are connected to each other and in assuring that no incomplete tasks affect the project schedule negatively.
Lead s
‘Leads’ is the control criteria that helps measure the ‘%’ of tasks that have a negative lag between each other. In particular, the term designates the overlapping time between two activities in the project schedule. In other words, it indicates the exact time (days) that would be overlapped if a task starts a certain time before the finish date of its predecessor.
The leads in the schedule should equal to zero, therefore there shouldn’t be tasks with a negative lag between each other. If there is a part of the schedule, which could prove itself as a potential problem, the tasks in question should be decomposed into separate tasks. This metric can impede the critical path analysis, therefore it is preferable that is used within the limits.
Lags
The metric ‘Lags’ is the opposite of ‘Leads’. Specifically, it allows an evaluation of the ‘%’ of project activities that have a positive lag between each other. The metric actually indicates the time (hours/days) calculated when a certain activity starts after the finish date of its predecessor.
The DCMA threshold for this metric is more flexible than the one for the Leads and it advises that the lags in the project schedule shouldn’t be greater than 5%. However, the excessive use of lags as well can cause an obstruction to the critical path analysis, therefore it is recommended that they are avoided. A good practice for this metric is to present activities with specific names rather than with an ‘X-days lag’.
Relationship Types
It is recommended that the 90% of the project schedule activities are of a finish-to-start type (FS). The finish-to-start type of relationship stands for ‘Activity A must be completed before activity B can begin’. This type of relationship between particular tasks is the foundation of the Waterfall method used in project management.
Finish-to-start relationship provides the most explicit presentation of the project schedule activities. The other types of relationships, which can be identified in a schedule, are finish-to-finish (FF), start-to-start (SS), and start-to-finish (SF). However, it is not recommendable for these to be used since they are harder to monitor and control.
Hard Constraints
Under ‘Constraints’ in a project schedule are identified Hard Constraints (Mandatory Start and Mandatory Finish) and Soft Constraints (As Late As Possible, Start On, Start On or Before, Start On or After, Finish On, Finish On or Before and Finish On or After).
DCMA recommends 5% of the constraints used to be Hard Constraints because they can provoke problems in the schedule. Hard Constraints can prevent the schedule to be logic-driven and create negative lags. In other words, Hard Constraints should be avoided since they can obstruct the logic of flowing naturally. Soft Constraints, on the other hand, allow the schedule to be logic-driven and they are not critical to the schedule.
High Float
This metric measures the ‘%’ of unfinished tasks with total float greater than 44 working days. DCMA requires that the High Float activity doesn’t exceed 44 working days, i.e. the percentage of total incomplete tasks doesn’t exceed 5%.
This metric represents the time (hours/days) that an activity can be delayed without affecting negatively the project milestones and/or the estimated time for project completion. A certain task with a total float that exceeds 44 working days could be a consequence of incomplete activities (predecessor/successor).
Negative Float
This metric is interconnected with Hard Constraints since it can indicate that Hard Constraints have been assigned to the schedule. When this happens, it is very much feasible that the project’s or milestones’ completion is delayed.
DCMA threshold for this metric is zero, therefore it is required that regular checks and reviews of the project schedule are executed. The Negative Float, or Slack, should be avoided, and, if tasks with a large amount of negative float are noticed, they should be mitigated or otherwise, the risk for a missing project or milestones deadlines could arise.
High Duration
This metric provides the possibility to monitor and control the duration of tasks and it requires that no task should last longer than 44 working days. If it is detected that the percentage of incomplete tasks with duration beyond 44 days is above 5% it is preferable to examine if it is achievable to decompose them in distinct tasks.
Breaking down activities allows them to be measurable and controllable. Tasks with high duration can create obstacles in the project schedule and progress and can deform the critical path.
Invalid Dates
The metric for Invalid Dates analyses both forecast and actual dates of project activities. An activity is considered to have invalid dates if it has forecast start/finish dates in the past or actual start/finish dates in the future. More specifically, this metric refers to tasks with actual start/finish date after project status date and with start/finish date before project status date without an actual start/finish.
‘Invalid dates’ is a very critical metric, therefore the goal is not to surpass 0%, i.e. tasks with invalid dates shouldn’t be present in the schedule.
Resources
The metric for ‘Resources’ is the most open-ended on the list. DCMA recommends that all project schedules are resource-loaded, but additionally, it allows some schedules to not include resources at all.
However, for those who are using this metric DCMA asks to not exceed the limit of 0%, i.e. to assign at least one resource (labor, cost and/equipment) to all activities included in the schedule so that a misbalance is avoided.
Missed Tasks
The metric for ‘Missed Tasks’ can cause or prevent the project to fall far behind. It assists in measuring the schedule performance in parallel to the baseline plan. Particularly, the number of missing tasks can indicate how well or badly the project schedule meets the baseline schedule.
The bad performance, i.e. the large amount of missed tasks can be a result of inadequate resourcing, poor planning or else. Consequently, DCMA holds that the number in question shouldn’t exceed 5% and if it gets critical, proper plans for correction are needed.
Critical Path Test
This test focusses on assessing the integrity of the schedule’s network logic. Firstly it is identified as a critical activity and its remaining duration. The next step is intentionally extending the duration of this activity for 600 days. The last step is recalculating the schedule dates and identifying if the date for completion of the project is extended for the same number of days applied to the critical activity.
The Critical Path Test is performed in order to inspect if these two numbers are proportional. In other words, if the project completion date is not delayed for the same amount of days (600 days) it means that somewhere in the schedule exists broken logic which may be a result of missing predecessor and/or successor activities. If this happens it is imperative to execute in-depth analysis of the project schedule.
Critical Path Length Index (CPLI)
The Critical Path Length Index (CPLI) presents the measure of the efficiency necessary for completing a milestone on assigned time. CPLI evaluates the integrity of the overall network logic and measures the ‘realism’ of completing a project successfully.
It is preferable that the CPLI equals 1.00, which means that the project must be completed within the planned time. A CPLI that is below 1.00 indicates that the project is inefficient, while a CPLI that is above 1.00 shows that the there is a schedule margin which means that the project may be finished earlier than planned.
Baseline Execution Index (BEI)
The Baseline Execution Index (BEI) test is a metric for evaluating schedule performance in parallel with the baseline plan but it focuses on the project’s team productivity in the process of executing activities.
Similarly as for the Critical Path Length Index (CPLI), DCMA for the Baseline Execution Index (BEI) test, the acceptable limit is 1.00, which indicates that the project team is performing well and according to plan. When BEI surpasses 1.00 it suggests that the team is performing ahead of schedule, while when it falls behind 1.00 it means that it is behind schedule.